White-paper
ETFmatic's white-paper: Transparent, peer-reviewed Digital Wealth Management
1. Our principles
Through our series of blog posts we have shared what we believe are the general truths that are applicable to investing. This includes the ample evidence that in general asset allocation trumps stock picking. We’ve covered why we believe ETFs are a good way of investing, and how important it is to pick a strategy that an investor is comfortable with and then stick with it. The value of saving and investing for the long term and how passive investment instruments usually deliver better returns than actively managed ones.
We’ve investigated how differences in returns are magnified when decision making is affected by emotional buying and selling and humans missing to manage behavioral impulses during times of volatile markets. It is important to avoid decisions driven by euphoria when investments soar and by depression when they tumble and tune out the day to day news about markets and the economy.
At ETFmatic we have implemented a range of investment strategies which were designed to avoid market noise and deliver long term investment returns. We have updated our offer and are now delivering both passive and active investment portfolios.
We currently offer 3 different passive investment portfolios: Starter Portfolios, Custom Portfolios and Glide Path Portfolios. The investment approaches followed by these portfolios ultimately seek to increase the value of the investment portfolio over the medium-long term. This means that rather than trying to time the market, they tend to ‘buy and hold’ assets.
On the other hand, we have partnered with Mads Pedersen (former head of UBS Global Asset Allocation team, where he managed strategies with more than $100bln in assets) to offer Adaptive Market portfolios which follow an active investment strategy. This investment approach includes behavioral-finance algorithms to limit investments drawdowns and increase returns via active asset allocation.
Our objective is to build the most tailored and transparent and cost-effective investment platform to allow our partners to improve their businesses and better service their clients. With this paper we aim to provide you with all the details you need to understand how we design investment strategies and implement, manage and maintain investment portfolios.
2. Investment proposition to B2B Partners
Select one of our off-the-shelf propositions or create your own
Through its B2B offer, ETFmatic allows other companies to provide automated wealth management services to their users. Partners can grow their business in a simple and affordable way.
We provide partners Pan-European availability which includes authorisation and customised investment propositions through a flexible and scalable technology platform. The implementation of the partnerships is quick and flexible thanks to our technology and extended platform capabilities.
ETFmatic enables other companies to:
- Increase user acquisition, retention and engagement
- Monetise an existing user base
- Reduce your cost-to-serve an existing user base,
- Extend product offering,
- Enter new market segments and internationalise their offering.
The investment strategies currently offered to our retail clients (explained later in this document) can be used as a proof of concept for our B2B prospects. However, the possibilities are infinite as through our agnostic platform partners can choose between existing products or implementing their own unique portfolio propositions.
ETFmatic not just allows B2B partners to develop their own investment propositions for their customers but also offers support on implementing delivery methods to end users:
- ETFmatic customizes a full suite of Desktop and Mobile apps to Partner’s specifications.
- Partner builds UX integrating pre-built components provided by ETFmatic.
- Partner fully builds UX into existing app by connecting to ETFmatic’s API enabled platform.
3. Adaptive Market Portfolios
EUR Adaptive Market portfolios include proprietary algorithms to limit your investments drawdowns and increase returns.
We are all aware of the impact that heavy losses suffered during market corrections have in our investments’ long time performance.
This is why we have partnered with Mads Pedersen (former head of UBS Global Asset Allocation team, where he managed strategies with more than $100bln in assets) to bring a new approach to managing risk, that combines machine learning & algorithms with the experience of a world-class asset allocator.
Starting from a base ETF portfolio (defensive / balanced / dynamic), Mads’ system will provide a signal to go risk off / on, aggressively decreasing / increasing the portfolio’s equity exposure. Looking at the recent past, this has happened 2-6 times per year and has resulted in avoiding the worst of the draw downs in Q4 2018 and in Q1 2020, generating significantly higher returns than “buy and hold” comparables.
3.1 Defensive
This is the most conservative premium strategy that starts with a base equity allocation of 30%, cutting it to 0% when a risk-off signal is received or going up to 50% when a risk-on signal happens.
The Defensive portfolio is based on a systematic investment process aimed at avoiding drawdowns while achieving participation in equity bull markets.
The strategy switches between base, risk-off and risk-on allocations according to a proprietary asset allocation algorithm.
The algorithm is designed to react quickly to volatile markets and the allocation is modified as soon as the signal is received, adjusting the portfolio’s risk exposure accordingly in order to avoid losses or provide gains when possible.
This approach limits volatility and drawdowns via decisive risk reductions and captures positive trends in equity markets.
3.2 Balanced
This is the middle-of-the-road premium strategy that starts with a base equity allocation of 45% cutting it to 0% when a risk-off signal is received or going up to 70% when a risk-on signal happens.
The Defensive portfolio is based on a systematic investment process aimed at avoiding drawdowns while achieving participation in equity bull markets.
The strategy switches between base, risk-off and risk-on allocations according to a proprietary asset allocation algorithm.
The algorithm is designed to react quickly to volatile markets and the allocation is modified as soon as the signal is received, adjusting the portfolio’s risk exposure accordingly in order to avoid losses or provide gains when possible.
This approach limits volatility and drawdowns via decisive risk reductions and captures positive trends in equity markets.
3.3 Dynamic
This is the most aggressive Adaptive strategy that starts with a base equity allocation of 67%, cutting it to 0% when a risk-off signal is received or going up to 100% when a risk-on signal happens.
The Dynamic portfolio is based on a systematic investment process aimed at avoiding drawdowns while achieving participation in equity bull markets.
The strategy switches between base, risk-off and risk-on allocations according to a proprietary asset allocation algorithm.
The algorithm is designed to react quickly to volatile markets and the allocation is modified as soon as the signal is received, adjusting the portfolio’s risk exposure accordingly in order to avoid losses or provide gains when possible.
This approach limits volatility and drawdowns via decisive risk reductions and captures positive trends in equity markets.
4. Standard Portfolios
We offer our clients three categories of Standard portfolios – Starter Portfolios, Custom Portfolios and Glide Path portfolios. The three categories use the same asset classes, and trade the same ETFs, have the same portfolio management philosophy and are managed individually.
The big difference is that starter portfolios allow clients to easily select between 21 asset allocations whilst custom portfolios are for the more sophisticated investors that want to build their own asset allocation. Glide Path portfolios offer automatic de-risking over the lifespan of the portfolio. All clients start with a straightforward starter portfolio and can then adjust their portfolios to become more tailored if this meets their investment needs.
4.1 Starter
Starter Portfolios are very straight-forward to set up while still giving the client some control over the overall asset allocation. Clients simply select a split of equity and bonds which is suitable for them based on three broad risk categories: Conservative, Balanced and Aggressive asset allocations. More conservative asset allocations will have a higher allocation to bonds (historically safer investments) while more aggressive portfolios will have a higher allocation to equities (historically growth assets).
Within the equity portion, we allocate to various regions based on the market cap weighting across the indices (see subsequent section for overview of the indices we use). Within the bond section of the portfolio we allocate 80% to the local government bonds and 20% to index-linked bonds.
Starter Portfolios allows our customers the following benefits:
- A straightforward portfolio management solution
- The ability to select the most suitable profile given their risk and return objectives.
- Setting a precise asset allocation, from 0 to 100% invested in equities/bonds.
- Rebalancing their portfolios correctly with increased contributions.
- Not having to worry about the index selection, ETF implementation, tax-efficient rebalancing and ensuring that the portfolio maintains its’ risk profile as markets and asset classes adapt and change.
The disadvantage with allowing a client to only choose a bond/equity allocation that matches their risk profile is that the portfolio won’t necessarily reflect all their unique preferences. Certain investors will have unique investment views that they would like to implement. That is why we offer Custom Portfolios.
4.2 Custom
Custom Portfolios allow clients complete control over their desired asset allocation. We present the exact same asset classes and regions we use to construct all our Standard portfolios, but allow clients to select their own target percentage weight in each. The underlying ETFs are still chosen by us, as discretionary manager, and are the same as the securities used in the rest of our standard client portfolios.
The target weight percentage of each asset class can be changed at any time, allowing more freedom to express long-term investment views.
With Custom Portfolios, someone with a specific investment view or desired asset allocation can easily construct a portfolio. Individuals with a bias (both positive and negative) towards a particular asset class or region can overweight or underweight that ETF to match their chosen investment view. The management and implementation of that asset allocation is then simply handed over to us.
The disadvantage of the Custom Portfolios is that a client would have to know which asset classes and combination thereof (the risk profile) are suitable for them. Individuals with strong investment views could also change their asset allocation frequently. However, this could not always be to the benefit of their long term investment goals and would require someone with knowledge and expertise in asset allocation.
4.3 Glide Path
Glide Path Portfolios enable clients to opt in for an automated change in their portfolio asset allocation over time, as they draw closer to their stipulated investment goal.
When an investor decides on the time horizon of their portfolio, they no doubt have an end goal in sight. As the goal draws nearer, the assumption is that you would most likely allocate less to growth assets (that have greater volatility) and more to historically conservative asset classes.
This potentially helps to protect the final portfolio value as the investor draws nearer to that moment in time when a defined amount of capital may be needed. This process of: (i) starting out with your defined target asset allocation and (ii) slowly adjusting the asset allocation over time may become a very manual process. It could mean changing the risk profile of the asset allocation to become more conservative and, to that effect, having to time it just right when doing that.
Our gliding portfolios allow clients to specify their current target asset allocation, their desired end glide-path asset allocation and the time horizon over which they would like to invest. The system will then calculate the desired allocation changes required over the time horizon and automatically adjust the asset allocation of the portfolio to ensure the final target allocation is achieved.
5. Commonalities between strategies
5.1 Asset Allocation
ETFmatic offers portfolios with exposure to two major asset classes: equities and bonds.
Equities
Equity instruments grant ownership in a company/companies. This exposure or what is commonly known as a share, is expected to be worth the future earnings one can expect from the company. Earnings generally tend to grow over time for a variety of reasons and, depending on the company region and period of time, can exhibit moderate to high levels of volatility.
In a growing economic environment, with low interest rates and inflation, equities tend to perform well as the companies that make up the stock market grow due to their increasing revenues and profits.
Bonds
Bonds represent a loan made by an investor to a borrower which could be a government or a corporation. These instruments are used by companies or governments to finance different kinds of projects and operations. Bonds’ principal is paid off at the end date and it usually includes the payment of variable or fixed interest coupons made by the issuer.
Etfmatic’s Standard portfolios include exclusively government bonds. Adaptive Market portfolios include both types of bonds according to the desired risk exposure of the portfolio.
The two asset classes (equities and bonds) tend to exhibit a low correlation with one another over longer periods of time. In a growing economic environment, earnings and profits grow and the shares of companies tend to do well. When investors are risk averse, they tend to allocate to bonds given their fixed payments and limited expected downside. These fundamentally different economic streams of returns (the variability of equities returns versus the fixed nature of bonds) means that historically, these asset classes have been suitable for diversification. Combining two asset classes that provide different streams of risks and returns in different economic environments means your overall portfolio should offer better risk-adjusted returns.
Other
ETFmatic has chosen not to include other asset classes (notably commodities and precious metals, real-estate, or other alternative investment instruments) in our universe.
While there are definite benefits to holding commodities within a portfolio we don’t think that the implementation offered through swap-based products, narrow Exchange-Traded Commodities (ETCs) or active funds that charge high fees justify their inclusion. Given our focus on simplicity we also don’t think it merits investing in futures to gain exposure to the asset class.
5.2 Index Selection
5.2.1 Index Selection for Standard Portfolios
The specific indices we have identified for each standard portfolio depending on its currency can be found in the following table:
ASSET CLASS | GBP | EUR | USD |
EQUITY | |||
US Equity | S&P 500 | S&P 500 | S&P 500 |
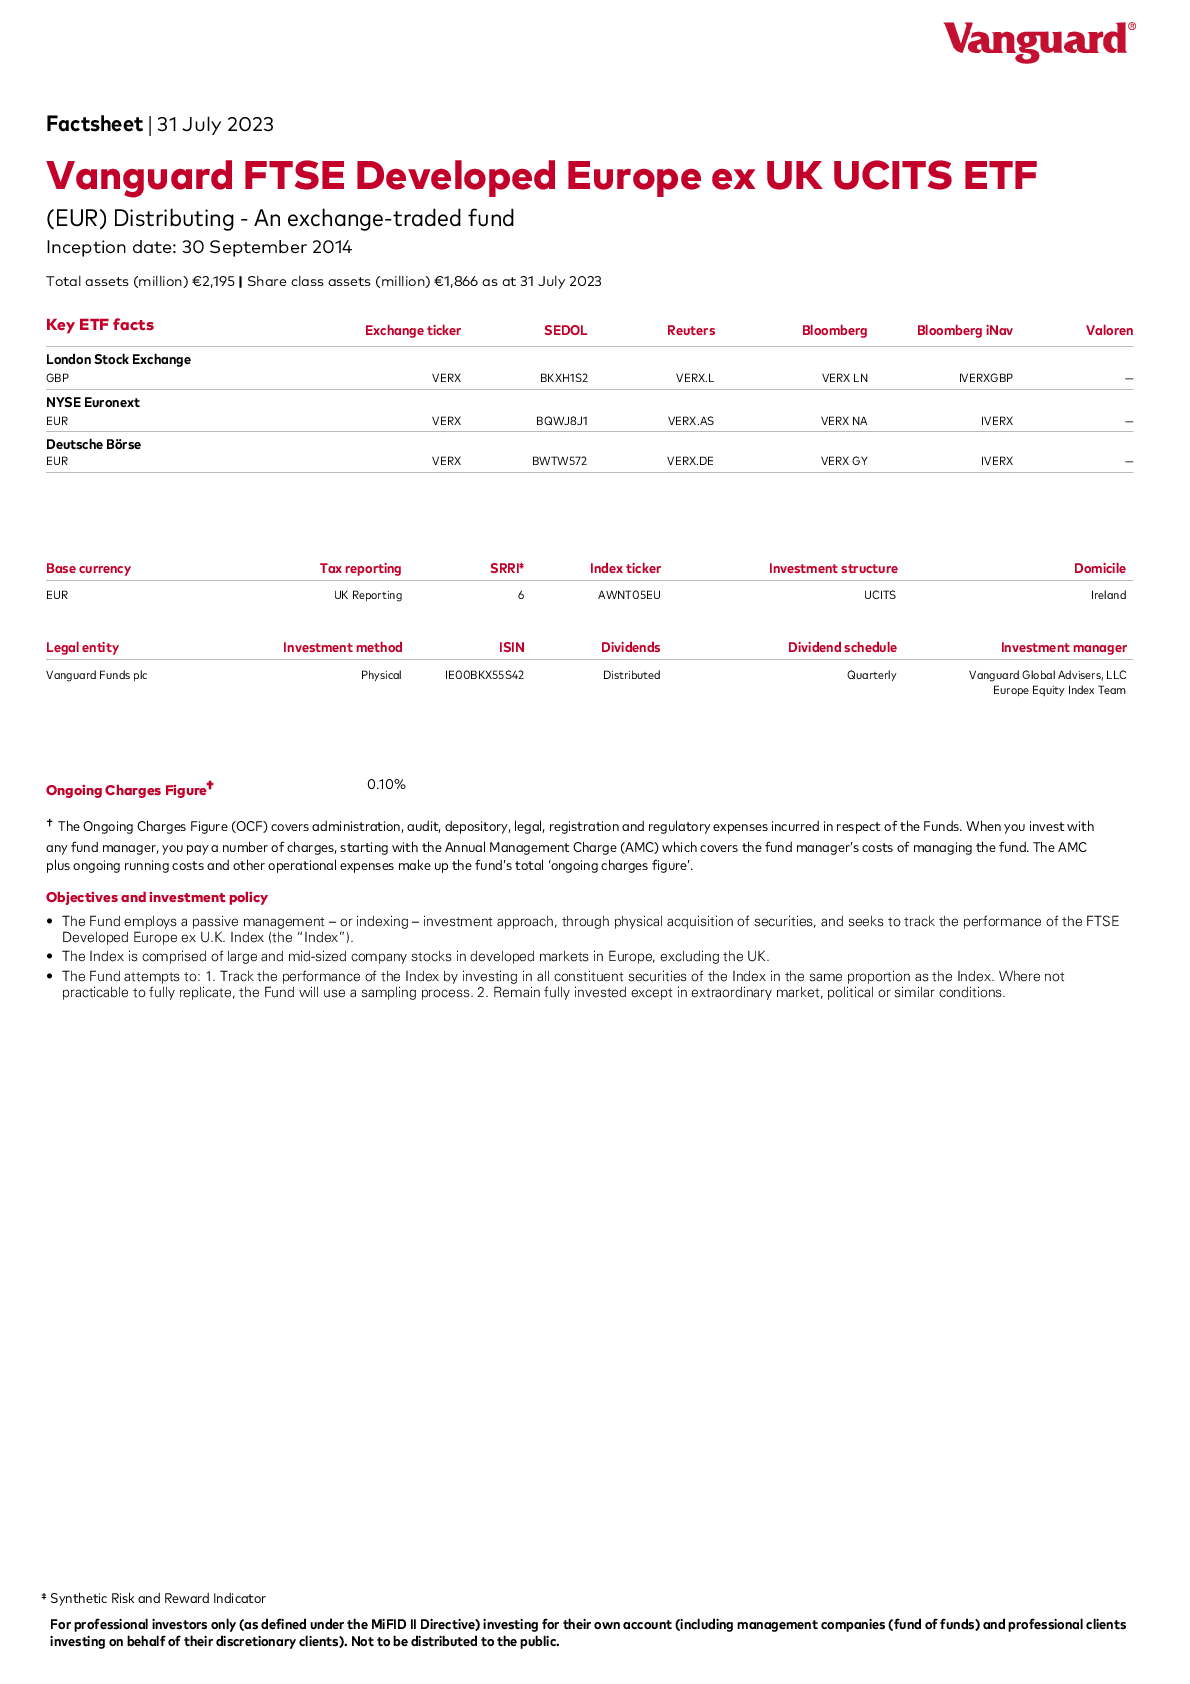
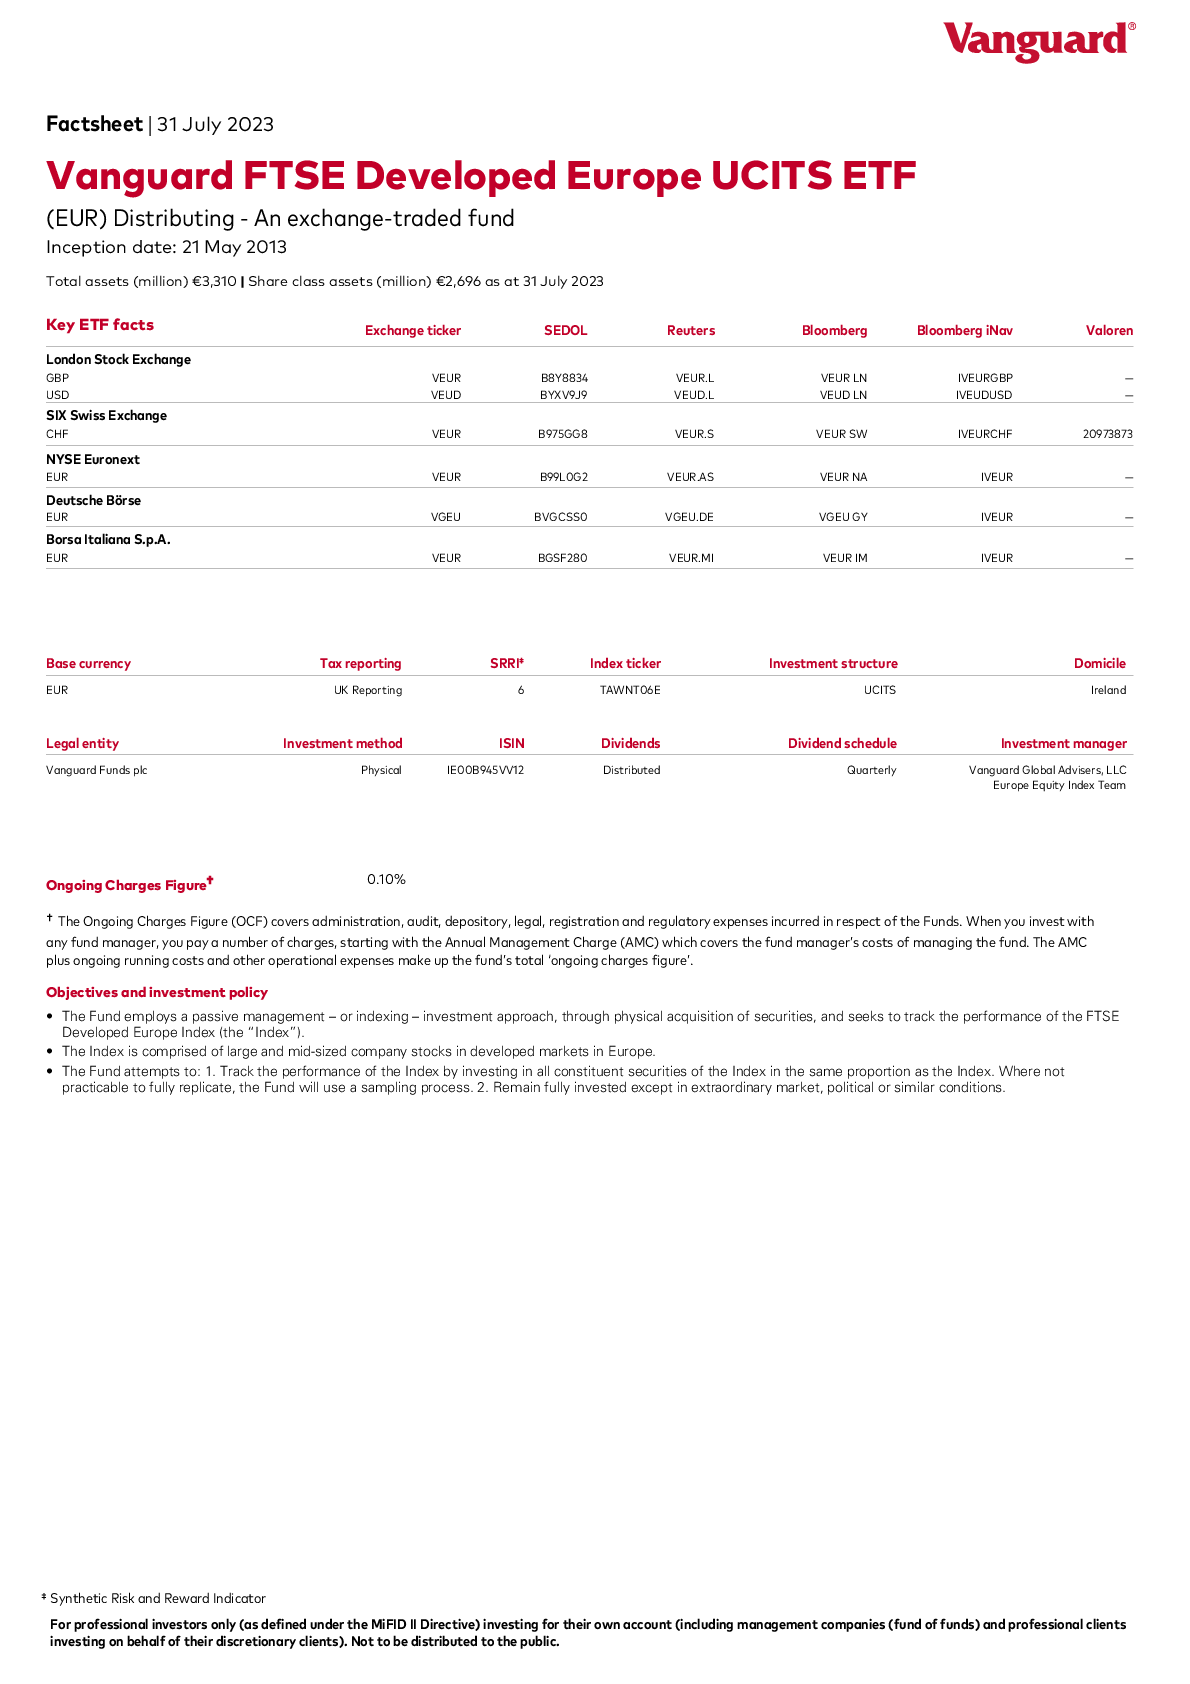
Europe Ex-UK Equity | FTSE Developed Europe ex UK | FTSE Developed Europe ex UK | FTSE Developed Europe |
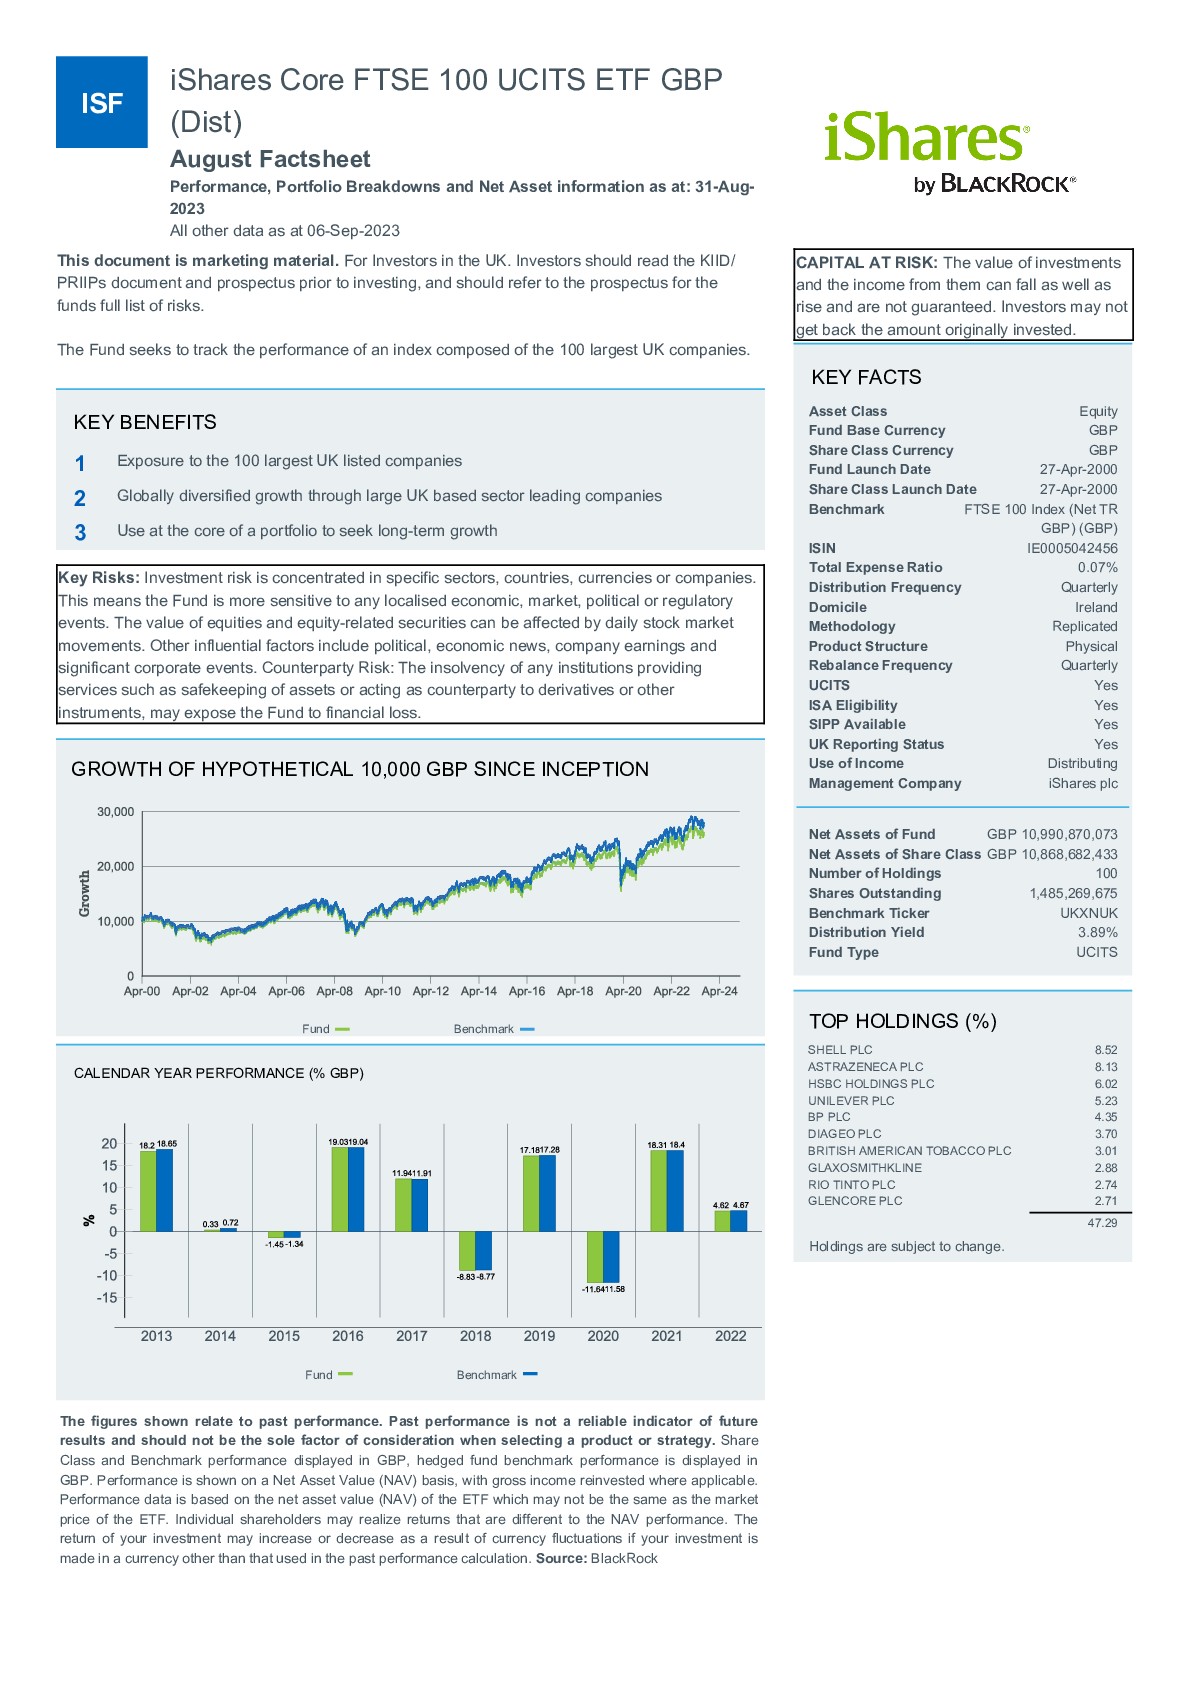
UK equity | FTSE 100 | FTSE 100 | |
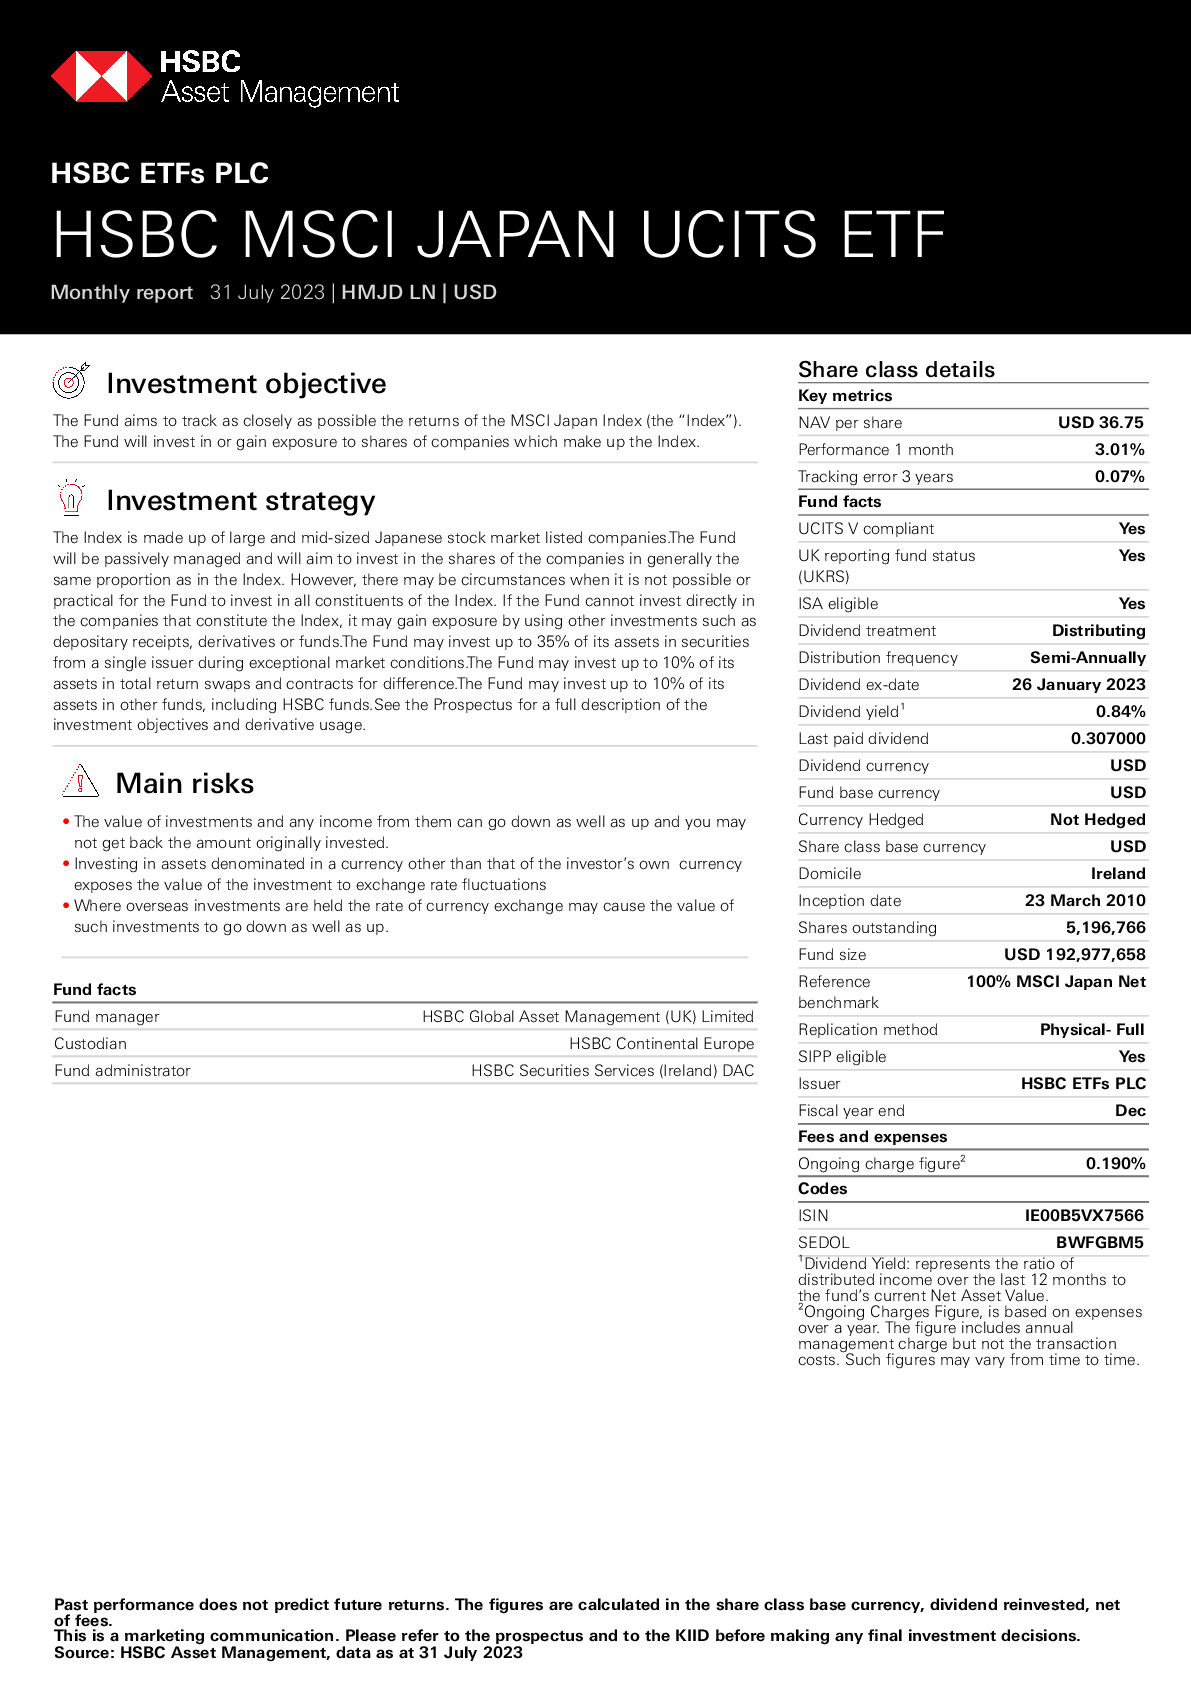
Japanese Equity | MSCI Japan | MSCI Japan | MSCI Japan |
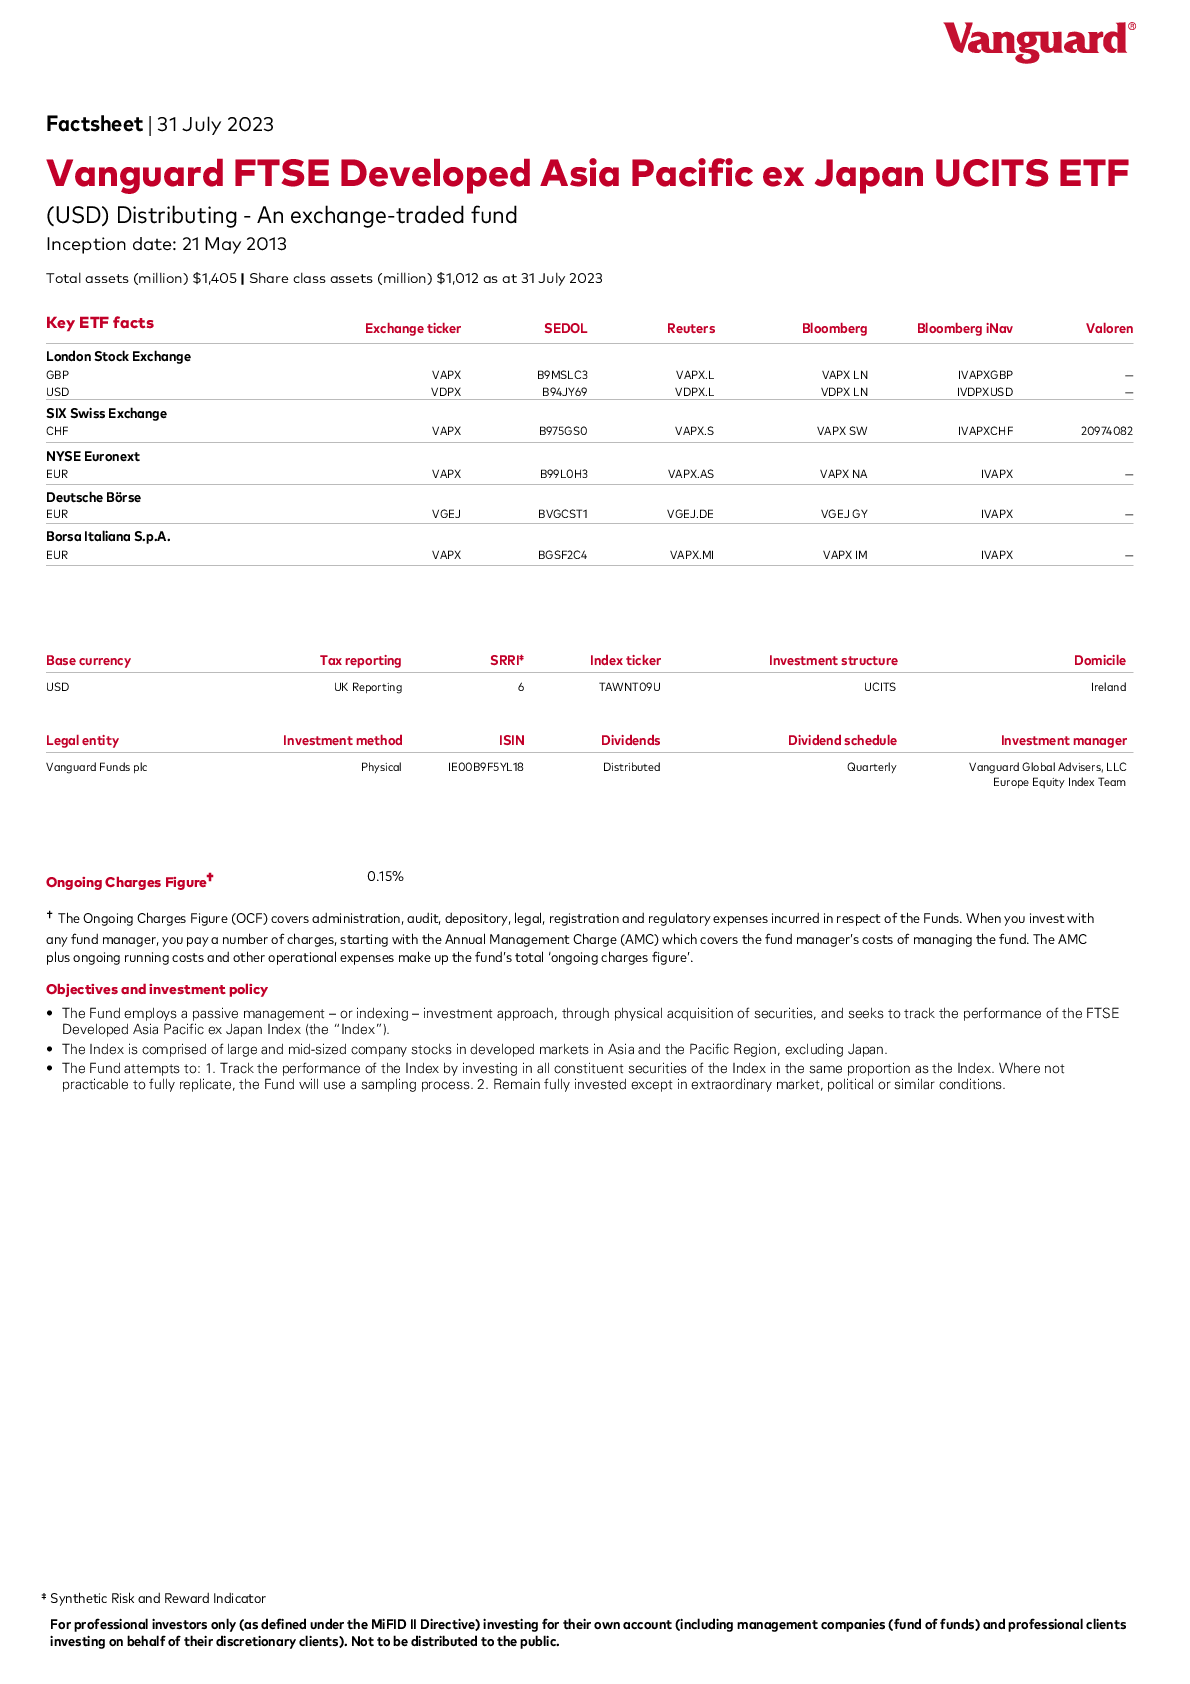
Asia Pacific Ex-Japan | FTSE Developed Asia | FTSE Developed Asia | FTSE Developed Asia |
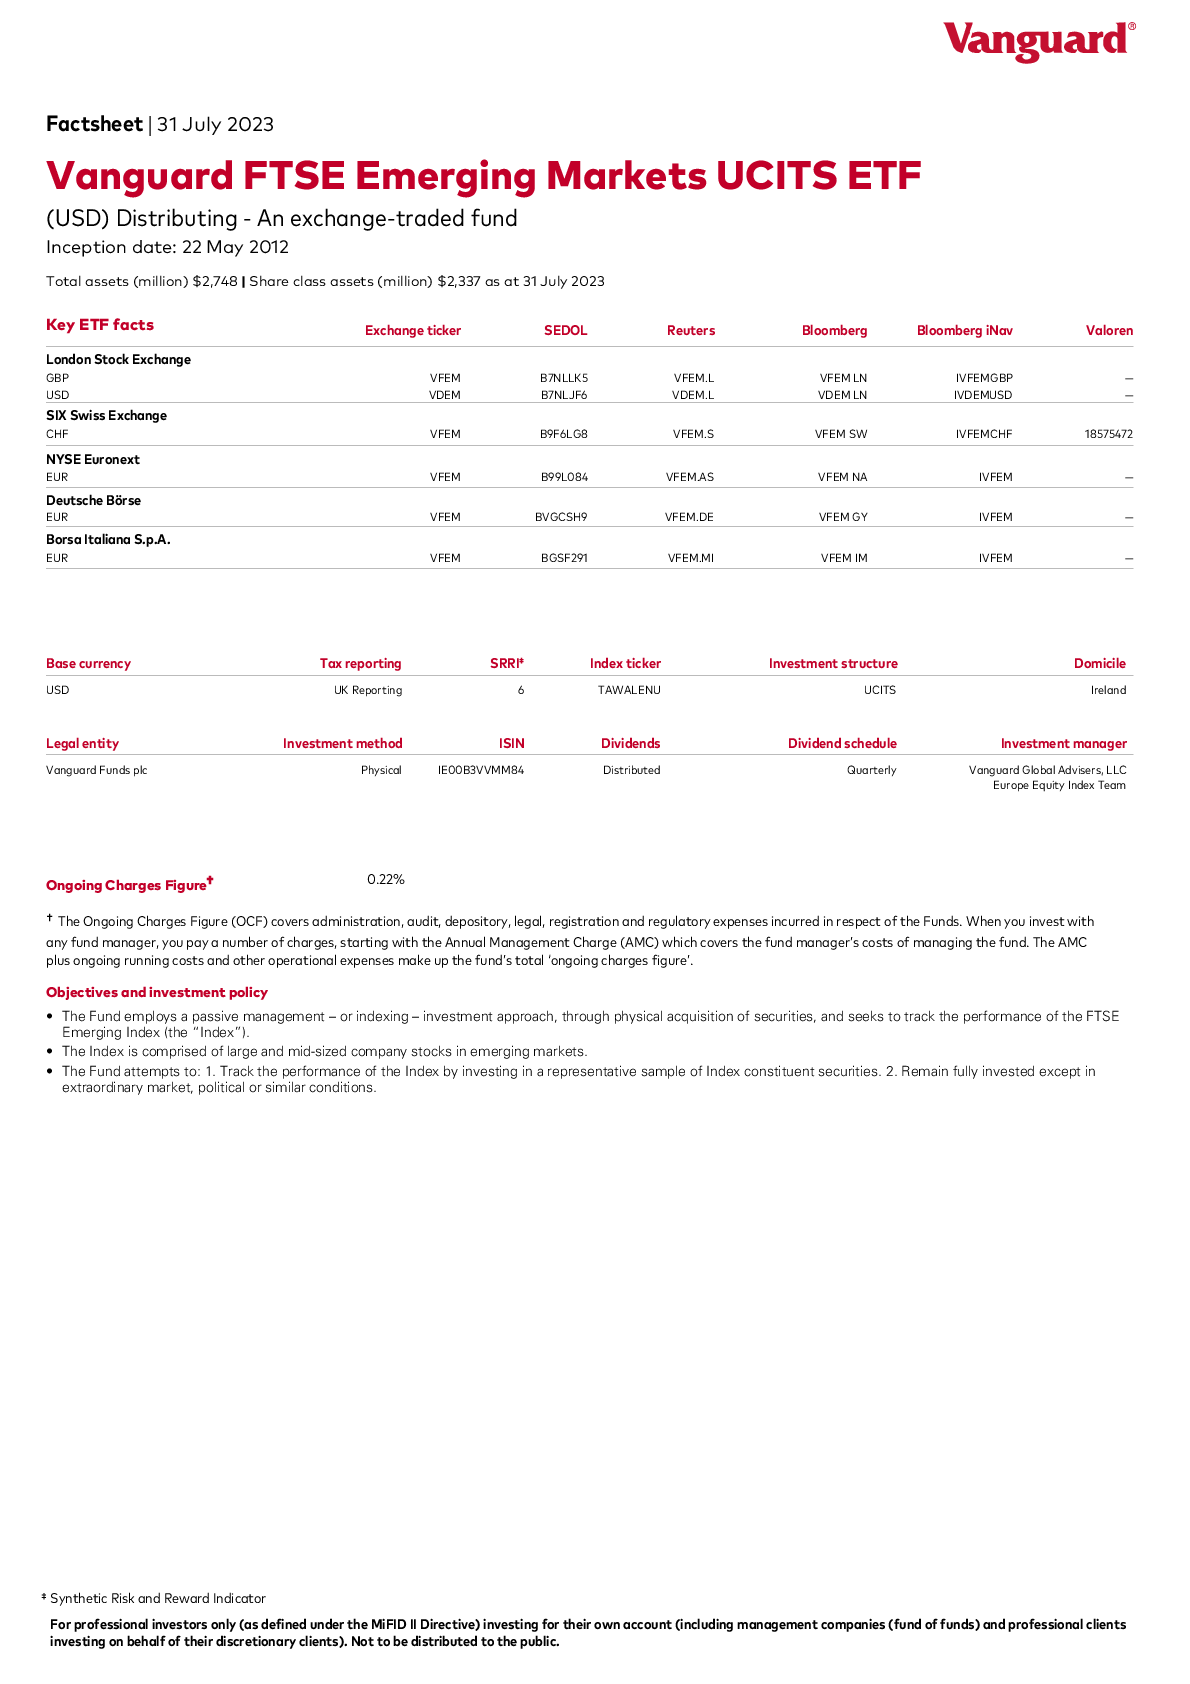
Emerging Market Equity | FTSE Emerging Markets | FTSE Emerging Markets | FTSE Emerging Markets |
FIXED INCOME | |||
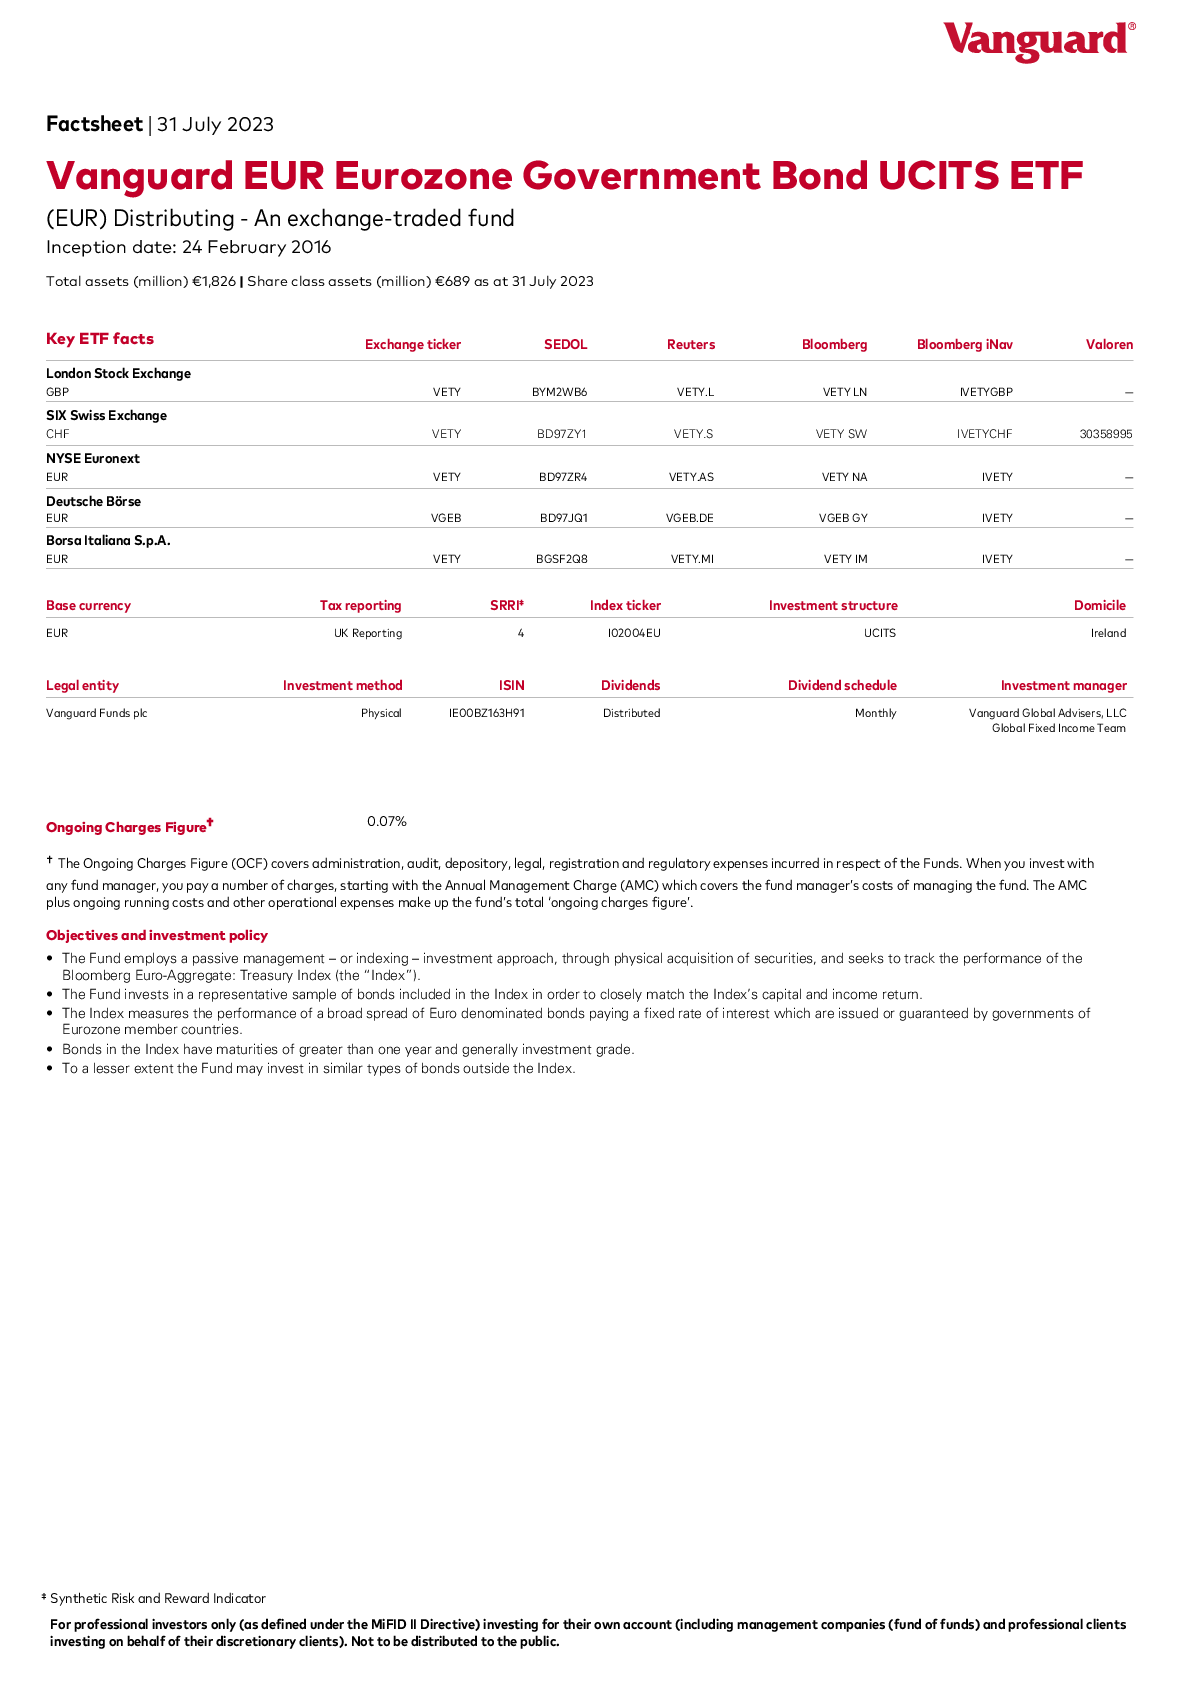
Home Bonds | Bloomberg Barclays Sterling Gilt Float Adjusted Index | Bloomberg Barclays Euro Aggregate: Treasury Index | Bloomberg Barclays Global Aggregate US Treasury Float Adjusted Index |
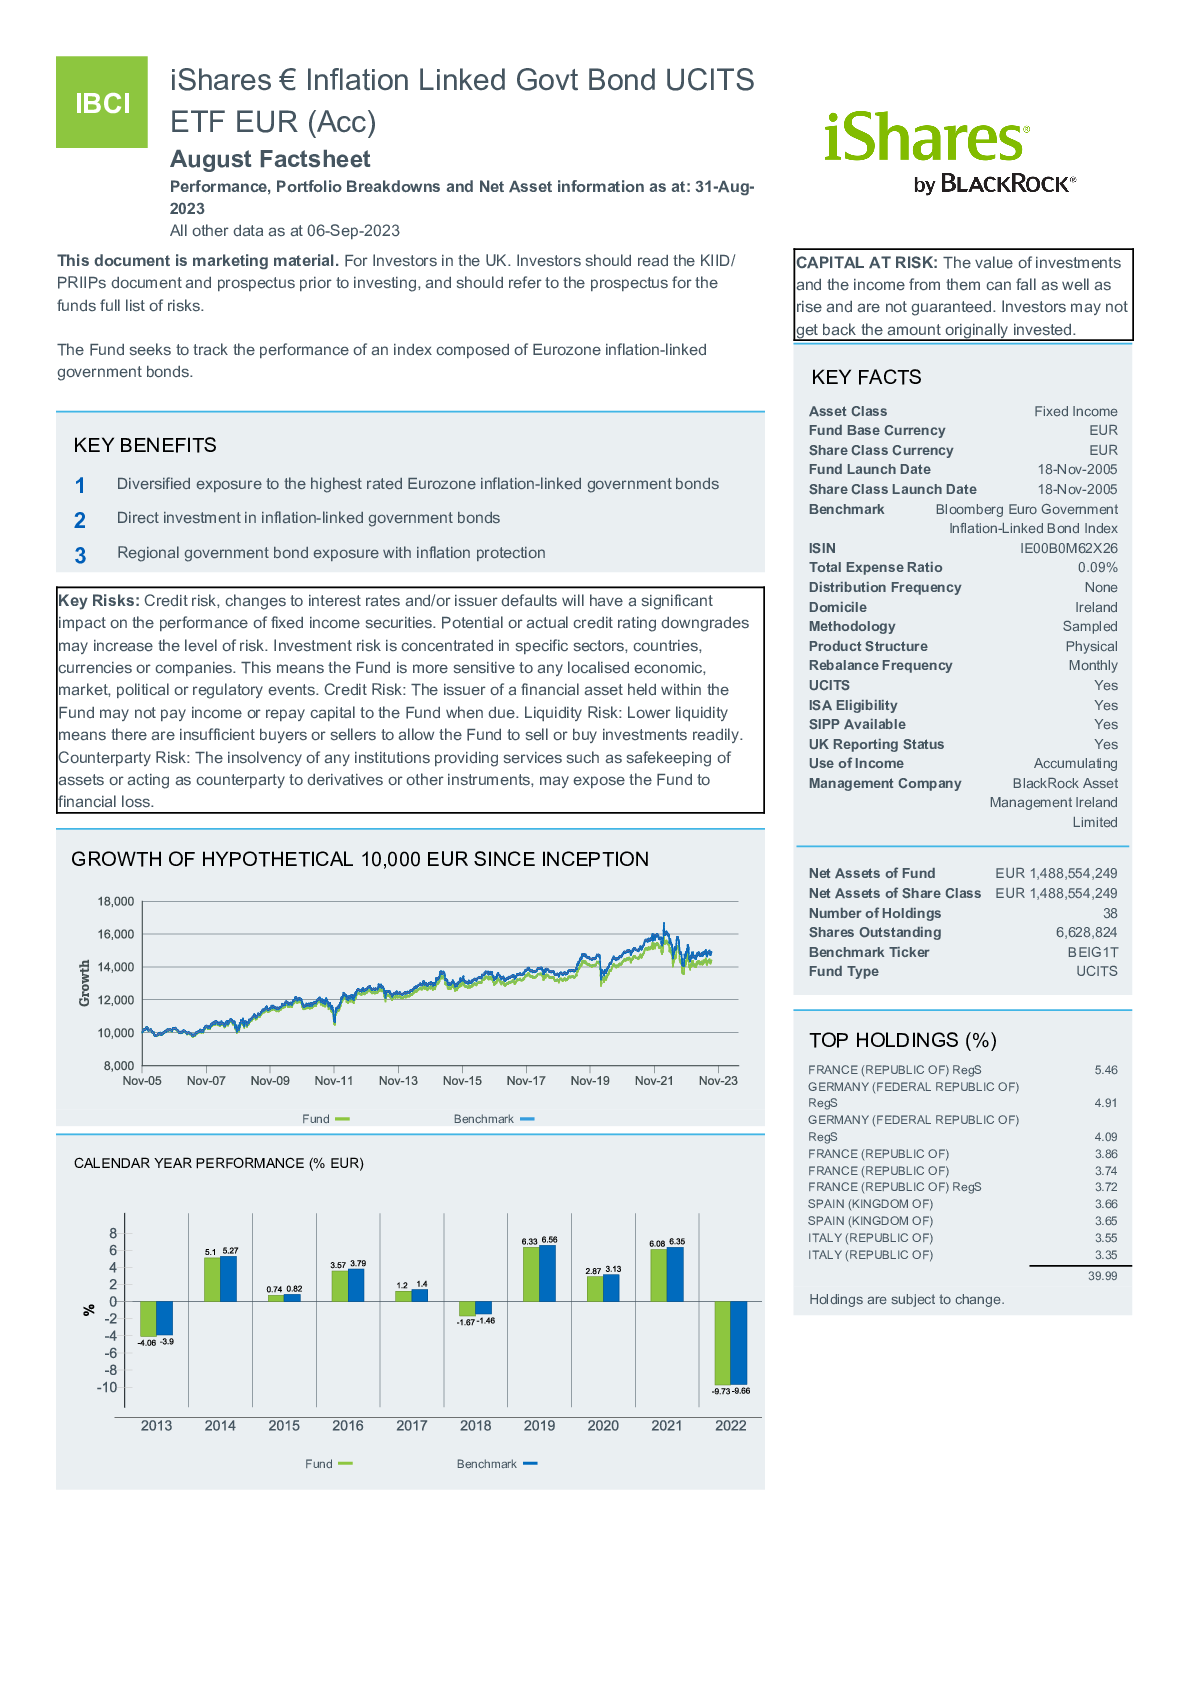
Inflation-Linked Bonds | Bloomberg Barclays UK Government Inflation-Linked Bond Index | Bloomberg Barclays Euro Government Inflation-Linked Bond Index | Bloomberg Barclays US Government Inflation-Linked Bond Index |
5.2.2 Index Selection For Adaptive Market Portfolios
The specific indices we have identified for each Adaptive Market Portfolio depending on its currency can be found in the following tables:
EUR | |
ASSET CLASS | |
EQUITY | |
US Equity | S&P 500® index |
World Equity | MSCI World index |
US Equity (non-financial) companie | Nasdaq 100® index |
European Equity | MSCI EMU index |
FIXED INCOME | |
Government Bonds 1-3 yr | Bloomberg Barclays Euro Government Bond 1-3 index |
Government Bonds 3-5 yr | Bloomberg Barclays Euro Government Bond 5 index |
Government Bonds 5-7 yr | Bloomberg Barclays Euro Government Bond 5-7 index |
Eur Government Bonds 7-10 yr | Bloomberg Barclays Euro Government Bond 10 index |
USD Treasury Bond 3-7 yr | ICE US Treasury 3-7 Year index |
USD Treasury Bond 7-10yr | ICE US Treasury 7-10 Year (EUR Hedged) index |
Euro High Yield Corporate Bond | iBoxx® EUR Liquid High Yield index |
USD High Yield Bonds | iBoxx® USD Liquid High Yield Capped (EUR Hedged) index |
5.3 Instrument Selection
As mentioned in our principles, there is ample evidence that shows that asset allocation has far more of an impact on your returns than what specific funds or ETFs you pick within any given asset class.
The indices that we have selected to represent each asset class have, in most cases, multiple ETFs tracking them. So how do we choose which ETFs we use?
5.3.1 ETF Choice
There are objective criteria that can be used to prioritise which ETF would, ex ante, most likely be a more appropriate selection than others. The criteria that we use include, in no special order of priority:
CRITERIA | COMMENT |
Issuer | This looks at the issuer of the ETF. Their track record, credibility & reputation, how many assets under management (AUM) do they have? |
AUM & Age | How long has the ETF been around for and how large is it in terms of AUM? If it is relatively new and with relatively low AUM? How serious do we judge the issuer to be? How large a share of the ETF’s AUM are our clients likely to represent? |
Total Expense Ratio | How expensive will the ETF be over the longer term? |
Tracking Error & Tracking Difference | How good a job does the ETF do at tracking its index? |
Distribution Policy | Does the ETF distribute the dividends it receives, and, if so, how frequently? |
Tax Status | Does the ETF issuer report the relevant tax information for it to be eligible to be included in tax wrappers? |
Tax Domicile | Where is the ETF domiciled, and what are the tax treaties between the ETF’s country of domicile and the countries where the underlying assets are domiciled? How does this impact the taxation of dividend distributions? |
Accounting Currency | How well does the ETF’s internal accounting currency match the currencies in the countries where the underlying assets are domiciled? |
Trading Currency | Does the ETF trade in the currency of the portfolio in which it is to be held or would there be the potential for inefficiencies due to currency exchange? |
Listings | On what exchanges does the ETF trade? |
On Exchange Liquidity & Spreads | How liquid is trading in the ETF on the exchanges where it is listed? How costly would it be to trade on said exchange? |
However, it is worth to keep in mind that not only is it likely that the relative ranking of ETFs replicating any given index may change over time, but there are also client or portfolio specific circumstances that may make it so that the ETF with the “highest” objective ranking is not the best choice for a given client.
5.2.3 Multiple ETFs per Index
When it comes to monitoring and selecting the best ETFs this invariably means occasionally switching from one provider to another. Based on the characteristics we detailed above, which we continuously monitor. Traditionally this has meant selling all your units in one ETF in order to buy another.
In line with ETFmatic’s objective of personalising each client’s portfolio, our platform is able to handle multiple ETFs tracking each index and to switch between them for a given client’s circumstances. As we continue to evolve our platform we will, therefore, increase the number of ETFs we hold for a given Index. The number of ETFs per asset class or region could vary for each client as we aim to offer better and more personalised products.
5.2.3.1 Standard Portfolios Instrument Selection
Below is an overview of the ETFs that we currently use to track the different Standard Portfolios’ indices:
PORTFOLIOS | GBP | EUR | USD |
EQUITY | |||
US Equity | |||
Europe Ex-UK Equity | |||
UK equity | |||
Japanese Equity | |||
Asia Pacific Ex-Japan | |||
Emerging Market Equity | |||
FIXED INCOME | |||
Local Government Bonds | |||
Index-linked Government Bonds | |||
5.2.3.2 Adaptive Market Portfolios Instrument Selection
Below is an overview of the ETFs that we currently use to track the different Adaptive Market Portfolios’ indices:
EUR PORTFOLIOS | |
EQUITY | |
US Equity | iShares Core S&P 500 UCITS ETF USD (Dist) |
World Equity | Xtrackers MSCI World Index UCITS ETF 1D |
US Equity (non-financial) companie | Invesco Nasdaq-100 UCITS ETF |
European Equity | Xtrackers MSCI EMU Index UCITS ETF 1D |
FIXED INCOME | |
Government Bonds 1-3 yr | iShares Euro Government Bond 1-3yr UCITS ETF (Dist) |
Government Bonds 3-5 yr | iShares Euro Government Bond 3-5yr UCITS ETF |
Government Bonds 5-7 yr | iShares Euro Government Bond 5-7yr UCITS ETF |
Eur Government Bonds 7-10 yr | iShares Euro Government Bond 7-10yr UCITS ETF EUR (Dist) |
USD Treasury Bond 3-7 yr | iShares USD Treasury Bond 3-7 UCITS ETF USD (Dist) |
USD Treasury Bond 7-10yr | iShares USD Treasury Bond 7-10yr UCITS ETF EUR (Dist) |
Euro High Yield Corporate Bond | iShares Euro High Yield Corporate Bond UCITS ETF EUR (Dist) |
USD High Yield Bonds | iShares USD High Yield Corporate Bond UCITS ETF EUR Hedged (Dist) |
GBP PORTFOLIOS | |
EQUITY | |
US Equity (GBP Hedged) | iShares Core S&P 500 UCITS ETF GBP Hedged (Dist) |
World Equity | iShares Core MSCI World UCITS ETF GBP Hedged (Dist) |
US Equity (non-financial) companie | Invesco Nasdaq-100 UCITS ETF |
US Equity | iShares Core S&P 500 UCITS ETF USD (Dist) |
UK Equity | iShares Core FTSE 100 UCITS ETF (Dist) |
FIXED INCOME | |
UK Conventional Gilts | iShares Core UK Gilts UCITS ETF |
UK Conventional Gilts 0-5 | iShares UK Gilts 0-5yr UCITS ETF |
UK Corporate Bond | iShares Core GBP Corporate Bond UCITS ETF |
Global High Yield Bond GBP Hedged | iShares Global High Yield Corp Bond GBP Hedged UCITS ETF (Dist) |
5.4 Ongoing Portfolio Management
So far we have provided details around how we construct the target allocations for our different portfolios. In this section we describe how we actually manage them on a day-to-day basis.
5.4.1. Updating Standard Portfolios Target Allocations
Standard Portfolios have static asset allocations that are reviewed and updated once per year. We currently use the MSCI ACWI as our representative index, so we review and update the weights in our Starter portfolios to match the regional weights and market capitalisation of the world equity markets according to the index. The target allocations of Custom Portfolios are defined by the client, who also decides how frequently to change the targethe
We calculate the best way of investing the funds to get each portfolio as close to target allocation as possible.
5.4.1.1 Standard Portfolios’ Rebalancing
Our standard portfolios offerings all have target weights for the different asset classes:
- With our Starter Portfolios these weights are updated once per year to reflect changes in the market caps of the different indices.
- The target weights of Custom Portfolios will change if a customer decides to change their asset allocation or liquidate their portfolios.
- The target weights of Glide Path Portfolios will automatically change to de-risk over the lifespan of the portfolio.
In deciding our rebalancing methodology, we reviewed several research papers that delved into the ideal frequency and best methodologies for rebalancing. We looked at the assets we use to construct our portfolios in terms of trading and settlement cycles. We considered the frequency of our asset class price feeds updates.
With this in mind, we have implemented a portfolio rebalancing methodology that uses twice weekly and semi-annual looks along with set tolerance bands and inner rails relative to a portfolio’s target weight.
5.4.1.2 Tolerance Bands and Inner Rails
Being dogmatic about rebalancing a portfolio back to its target weights can often generate unnecessary trades where the tax implications outweigh the benefits of bringing the portfolio back to the exact target weights. Research suggests that a better way to manage rebalancing is to allow portfolios to drift slightly from the target allocations before assets are sold off in order to bring the portfolio back to target.
How far from the target a standard portfolio is allowed to drift is commonly referred to as the “tolerance bands”. Our aim is to set tolerance bands in place that are wide enough to allow for natural drift to occur and prohibit costly frequent rebalancing, whilst narrow enough so that the portfolio’s asset allocation mix adheres to the long-term chosen risk profile.
The same research also suggests that, when selling off assets to rebalance, it is possible to be flexible about how close the portfolio should be brought to the target weights to further minimise the implicit and explicit costs of trading. This flexibility is bounded by what is usually referred to as the “inner rails.”
The tolerance bands and rails define what triggers a rebalance but do not determine when it is to be reviewed and implemented. There is a variety of research on how often a portfolio should be rebalanced. Given our focus on costs, we have segmented our frequency of rebalancing for portfolios as follows:
We have chosen to set tolerance bands that are 20%, on a relative basis, on either side of a standard portfolio’s policy weight. We have further chosen relative weights of 10% for what we define as inner rails. These percentages were used and they were most compelling in the research in terms of portfolio returns, frequency of trades (reducing costs) whilst adhering to a portfolio’s policy weights.
We use our upper and lower tolerance bands to trigger rebalancing and our inner and upper rails as the points to rebalance to. Rebalancing to inner and outer rails rather than the exact policy weights will hopefully ensure trades (implicit and explicit costs) are minimized whilst the policy weights and risk profile of the portfolio is strictly maintained.
5.4.2. Updating Adaptive Market Portfolios Target Allocations
Adaptive Market portfolios are actively managed to bring a new approach to managing risk, that combines machine learning & algorithms with the experience of a world-class asset allocator. The Adaptive portfolios’ target allocations will be modified when Mads Pedersen behavioral finance-based algorithms indicate that the risk exposure of the portfolios needs to be modified.
The Adaptive portfolios’ target allocations and risk exposure will be updated on the following way:
- The Defensive strategy starts with a base equity allocation of 30%, cutting it to 0% when the algorithm generates a risk-off signal, or increasing to 50% when a risk-on signal triggers.
- The Balanced strategy starts with a base equity allocation of 45%, cutting it to 0% on a risk-off signal or increasing to 70% on a risk-on signal.
- Finally, the Dynamic strategy is the most aggressive. It starts with a base equity allocation of 67%, cutting it to 0% on a risk-off signal, or increasing to 100% on a risk-on signal.
5.4.3. Investing Cash
Whenever clients invest funds, whether an initial amount or recurring contribution, we allocate the cash as mathematically accurately as we can to reach the target asset allocation of the portfolio. As soon as we receive the funds, we will invest them according to the target asset allocation within the next available trading window.
Given that the bid and offer prices of ETFs constantly move in the market we implement a safety buffer in our calculations as a safeguard against overspending any cash. This means that once your funds are invested there might be a small residual of cash left in the portfolio. Our system will allocate that cash on the very next trading windows. We, therefore, aim to invest all cash as mathematically accurately as possible, investing to the nearest decimal when we are able to.
5.5 Trading
Once we have generated the instructions for what trades we should do on each portfolio, we move on to executing those instructions. We first do an internal netting and aggregation of the instructions and then we go to trade the net demand or supply in the market.
Client Account Internal Netting
We look at each client account to see if it has multiple portfolios, and if so how much of the rebalancing can be done by moving money and assets between the different portfolios. Since this is all done within the same account, it does not trigger any tax consequences.
Global Aggregation and Netting
Secondly, we look at to what extent we can net off transactions across client accounts. This has the benefit of reducing the volume we need to place into the market, thereby reducing both explicit costs as well as our overall impact on the market pricing of the ETFs (the implicit costs) we trade in.
After netting and aggregating, we take the remainder and send orders to market. Currently, we trade in the market at least twice per week. The price we get when trading in the market is also the price that is used for the internal netting.
The day after we have completed all the trading we send all our clients a transaction report summarising exactly what trades we did on their behalf.
We also ensure that each portfolio receives its due dividends and that the clients are properly informed of the dividend distributions that their portfolios receive.
5.6 Fees and Portfolio administration
5.6.1 Fees
We only charge fees for the assets we manage on your behalf. These charges are based on your average assets under management per period.
The ETFs we invest in will also have their underlying Total Expense Ratios (TERs). The TERs are costs associated with managing and operating an investment fund charged by the issuers and included on the asset price at the moment of trading. The total weighted average costs of the TERs will vary depending on the asset allocation chosen.
Below you can find a chart that shows what the total costs of an ETFmatic portfolio are composed of:
ETFmatic Annual Management Fee | Maximum Weighted Average TER | Minimum Weighted Average TER | Maximum Total All-In Costs | Minimum Total All-In Costs | |
Starter and Glide Path Portfolios | 0.48% | 0.10% | 0.07% | 0.58% | 0.56% |
Custom Portfolios | 0.48% | 0.22% | 0.07% | 0.70% | 0.55% |
Adaptive Market Portfolios | 0.75% | 0.17% | 0.14% | 0.92% | 0.89% |
These numbers are only indicative and will change as the ETFs in the portfolio change. We do not charge our clients any additional transaction, custody or maintenance fees.
As part of our commitment to transparency we also send all our clients monthly summaries of fees so that it’s clear exactly what we charge for the service we provide.
5.6.2 Reporting
We provide our clients monthly account statements. These statements detail exactly what ETFs are held, and the number of units and valuation of each holding. We also provide a summary of the previous month’s movements, including how much new money was invested in the account, how much was received in dividends, the impact of our fees, and finally, how much the account changed in value due to fluctuations in market prices.
At the end of each tax year we also send out a consolidated summary of all purchases, sales and dividend payouts, which can be used by each client to complete their tax filings.
5.7 Liquidation of portfolios and withdrawals
We know that clients use the investment returns in their portfolios to fund personal life expenses and therefore require the ability to withdraw funds periodically. We have made this incredibly simple with our withdraw funds button within our portfolio dashboards. This allows a client to specify the amount (to the nearest hundred) that they would like to take out of their portfolio.
The withdrawal functionality provides the ability to take up 90% of the portfolio as long as the amount invested left remains above our minimum investment of GBP/USD/EUR 1000. We have chosen this 90% threshold, as taking amounts greater than this would effectively be the same as liquidating the entire portfolio.
Once we have received the instruction the partial withdrawal request will be executed within our next trading window. Our system first looks to see what cash is already available in the portfolio and puts that to one side. Our selling methodology then focuses on selling any or all assets back down to the target weights of the portfolio. Starting with the most overweight assets and moving down to the least overweight our system will iteratively sell down any holdings until the required cash is raised. Therefore not only raising the required funds, but also leaving the portfolio as close to the target asset allocation as possible given the size of the portfolio.
Given our trading windows, cash will be available in roughly 3 to 7 working days. Our policy is to transfer any cash back to the bank account from which the goal was initially funded.
5. Platform Capabilities
At ETFmatic we provide a variety of services to help our B2B partners improve their services and grow their businesses. Below is an overview about the services provided by ETFmatic:
- Implementation of investment strategies: Design and develop new investment methods.
- Portfolio Management: Manage portfolio models, rebalancing strategies etc.
- Trading and execution: Trading and confirmation of trades.
- Money and Asset Custody: Holding and servicing assets (dividends, splits, etc)
- Money Flows: Cash IN, Cash Out including AML & Transaction Monitoring
- Client onboarding: Know Your Customer, Customer due Diligence
- Helpdesk: Managing communications with clients for issues related to services above
We also provide our partners a variety of delivery methods to end users through our API platform.
At ETFmatic our main focus is to continue powering wealth management into the future. If you are interested in working together and exploding your business potential feel free to give us a call or send us an email.
